As a passionate data analyst, I specialize in transforming complex data into clear, actionable insights using Tableau. My goal is to create compelling, interactive dashboards that tell a story and empower users to make better business decisions. This portfolio showcases my ability to clean, model, and visualize data across various industries.
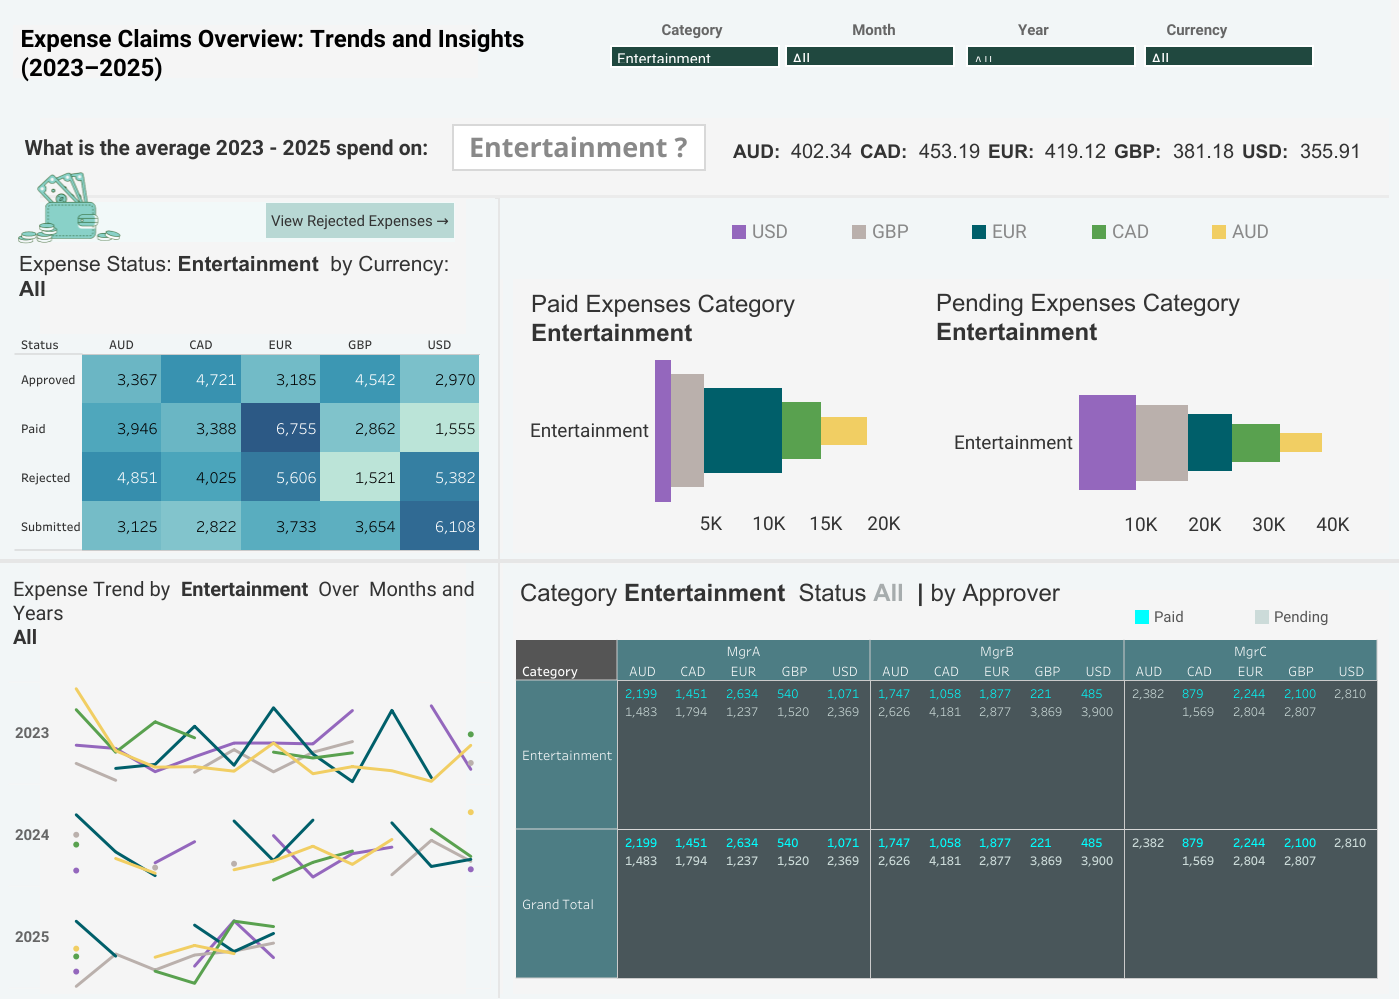
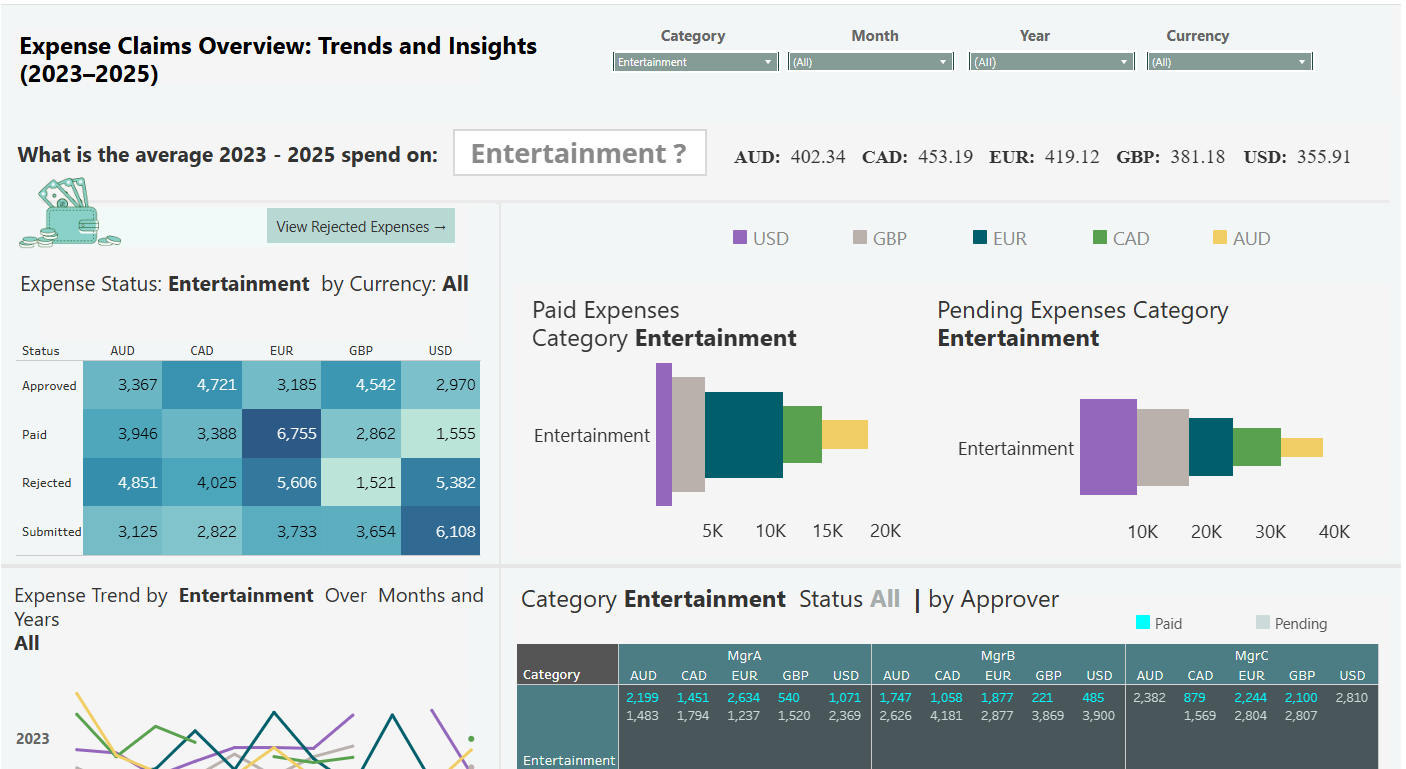
Objective: The primary objective of this dashboard was to develop a financial performance tool that provides clear, dynamic insights into expense trends and spending behavior across different business years (2023–2025).
Key Users & Value: This visualization is specifically designed to support targeted decision-making:
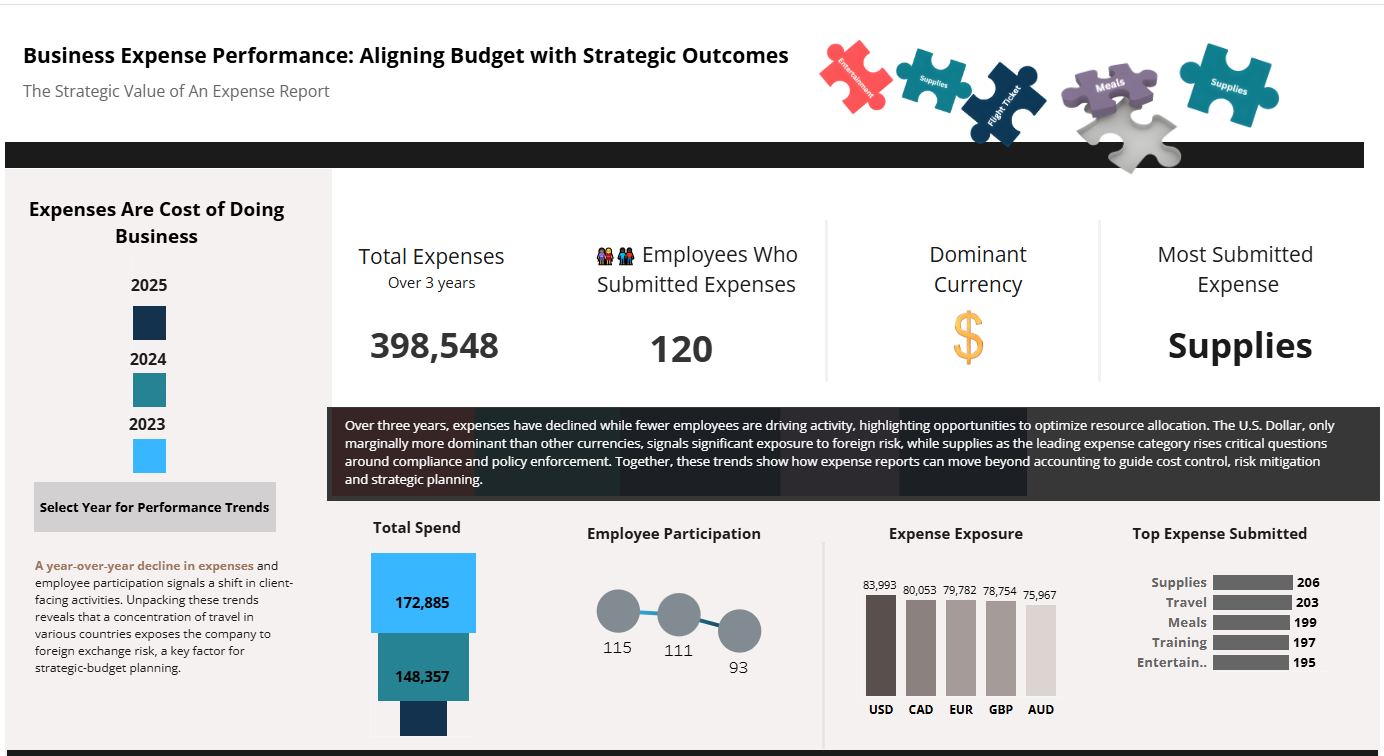
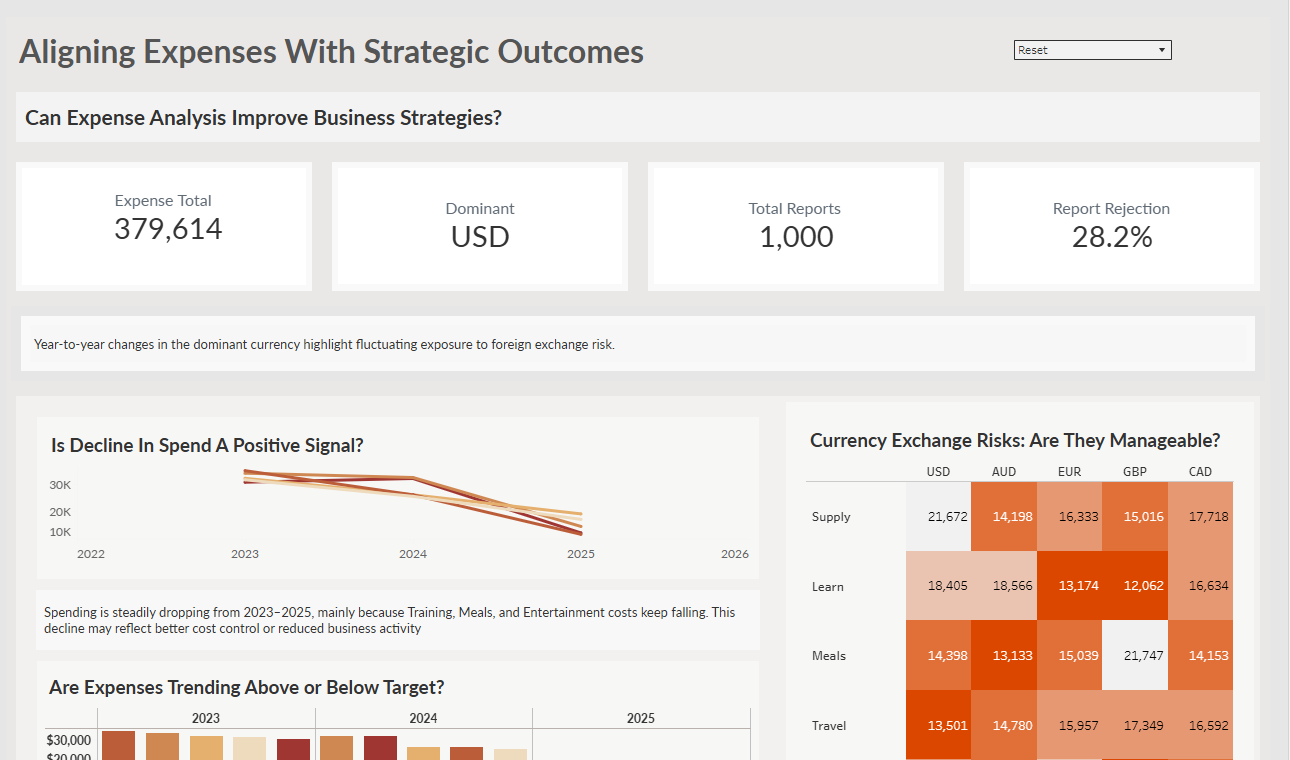
This consultant-style dashboard moves beyond simple expense tracking to convey the **strategic value** of expense report analysis. It provides leadership with actionable insights to optimize spending and support better financial decision-making.
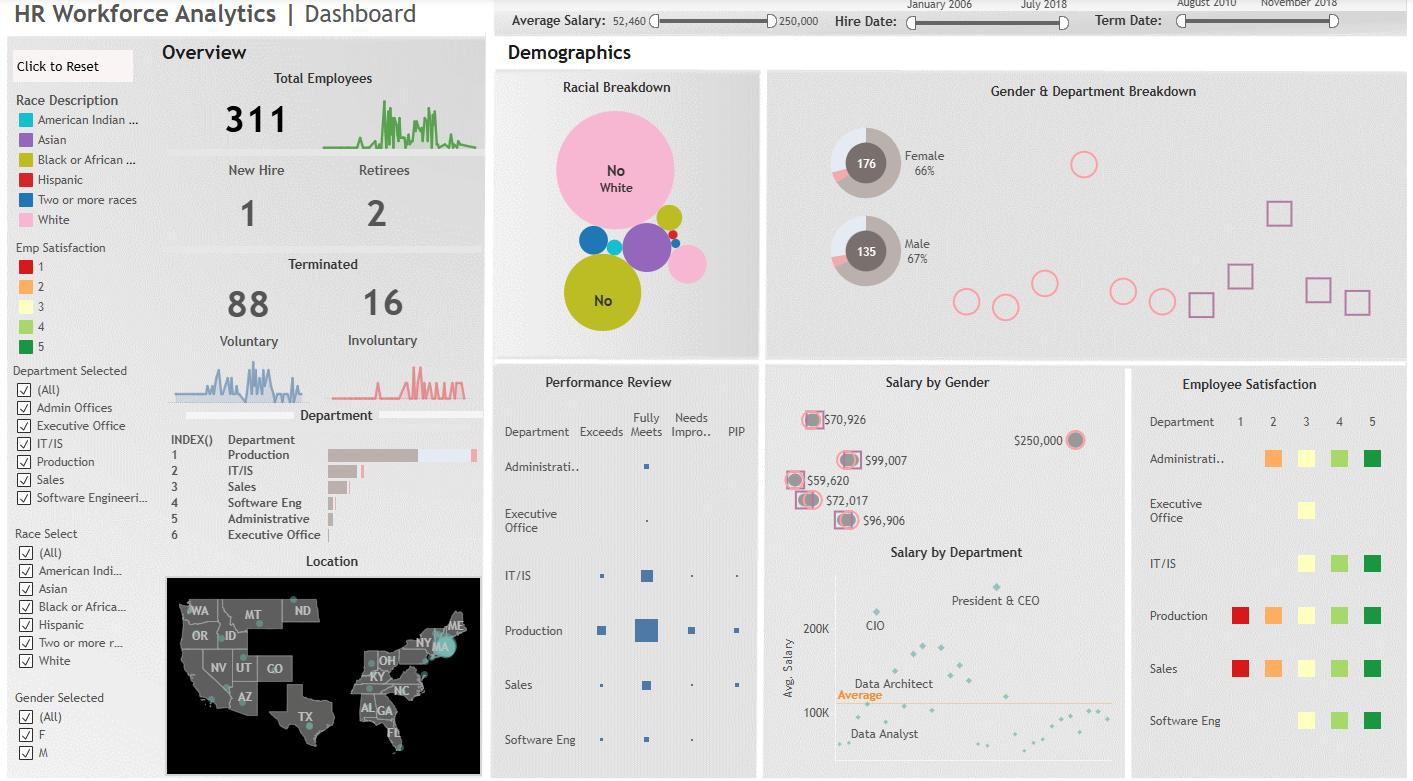
This dashboard analyzes employee data to identify key factors influencing attrition and performance. By visualizing turnover rates, employee satisfaction, and performance metrics, it helps HR managers understand workforce trends and make proactive decisions to improve employee retention and overall productivity.
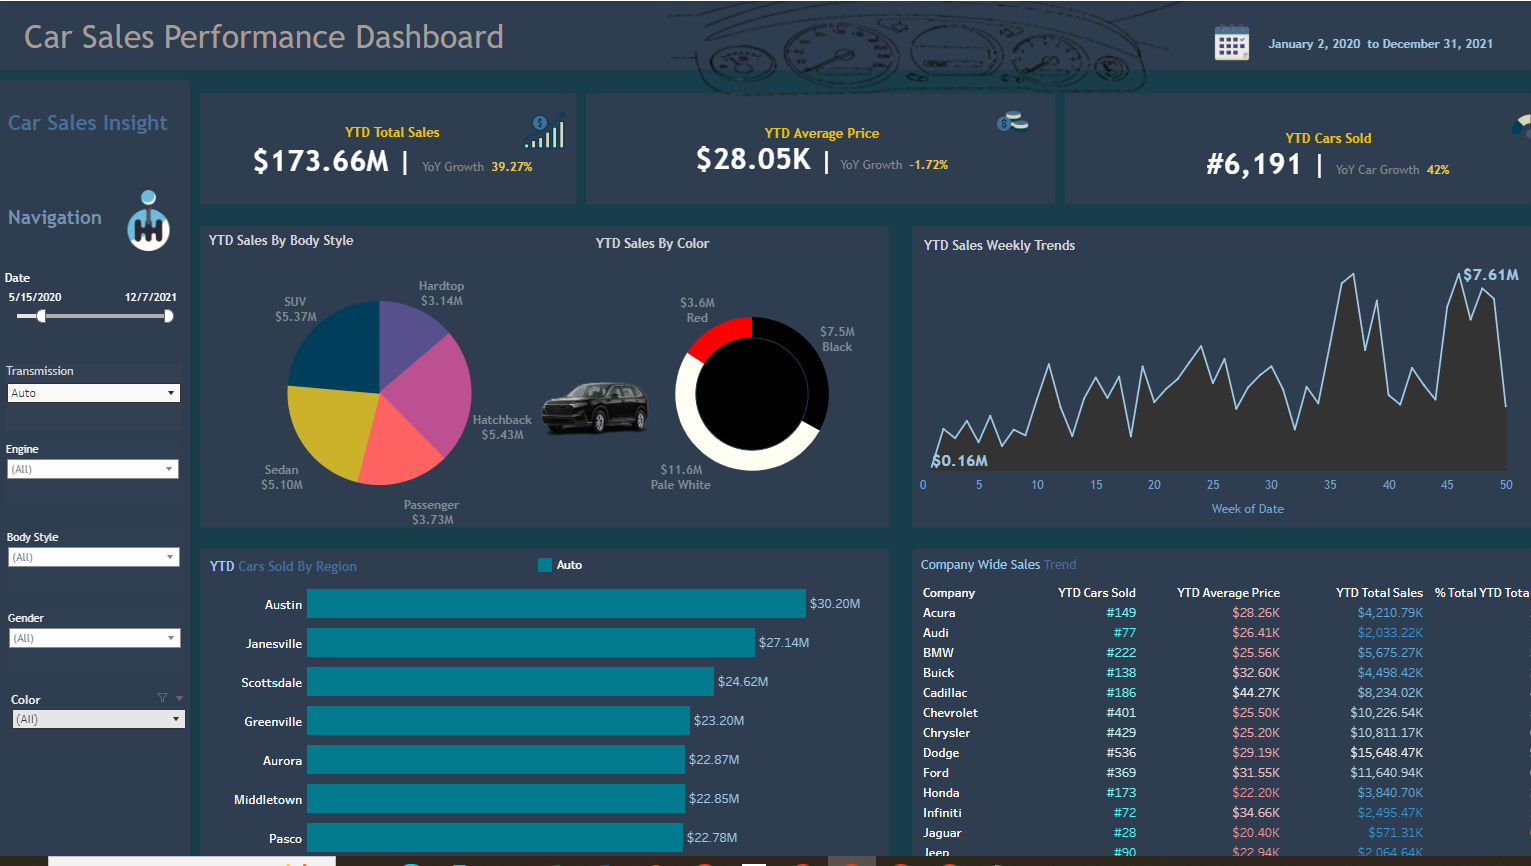
This interactive dashboard provides an overview of car sales performance, allowing stakeholders to track revenue, sales volume, and regional trends. By filtering data by car model, dealership, and time period, the dashboard helps identify top-selling vehicles and optimize sales strategies.
This dashboard tracks and visualizes employee expense claims to help a company monitor spending patterns. It enables financial analysts to identify high-spending departments, categorize expenses, and flag potential anomalies, leading to better budget management and compliance.