
As a passionate data analyst, I specialize in transforming complex data into clear, actionable insights using Power BI. My goal is to create compelling, interactive dashboards that tell a story and empower individuals and businesses to make better business decisions. This portfolio showcases my ability to clean, model, and visualize data across various industries.
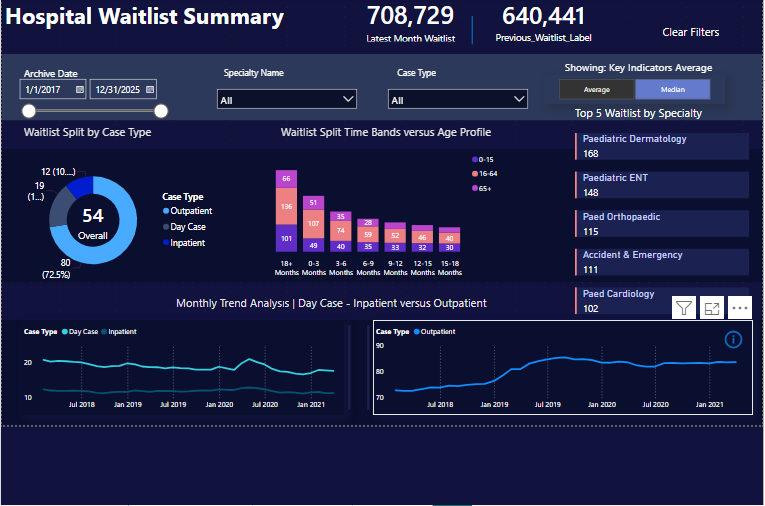
This dashboard was created to help hospital administrators monitor and manage wait times. I used Power Query to clean and transform raw patient data, then built key metrics to track patient flow, identify bottlenecks, and visualize trends over time. The dashboard helps administrators make data-driven decisions to improve patient care and reduce wait times.
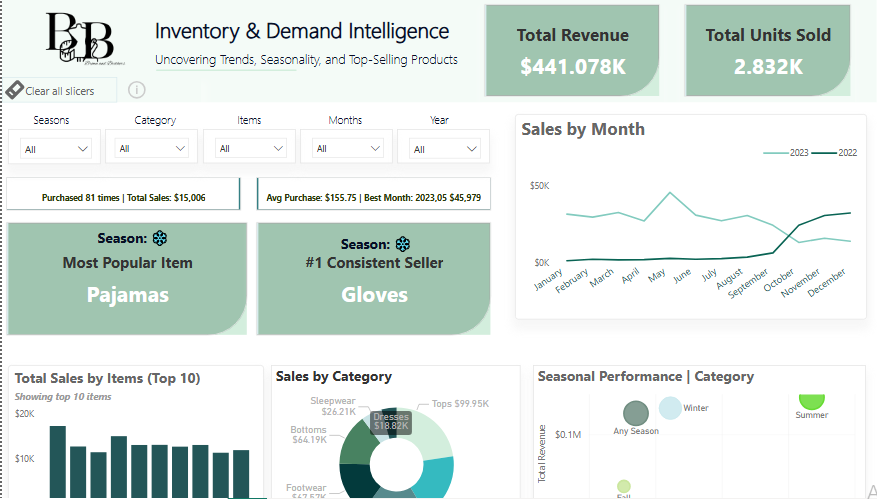
I developed this dashboard to provide a comprehensive view of inventory and revenue for a fictional retail company. By integrating sales and product data, I created a dynamic dashboard that allows stakeholders to analyze product performance, track sales goals, and optimize inventory levels. Key features include a DAX-driven profit margin calculation and interactive slicers for detailed analysis.
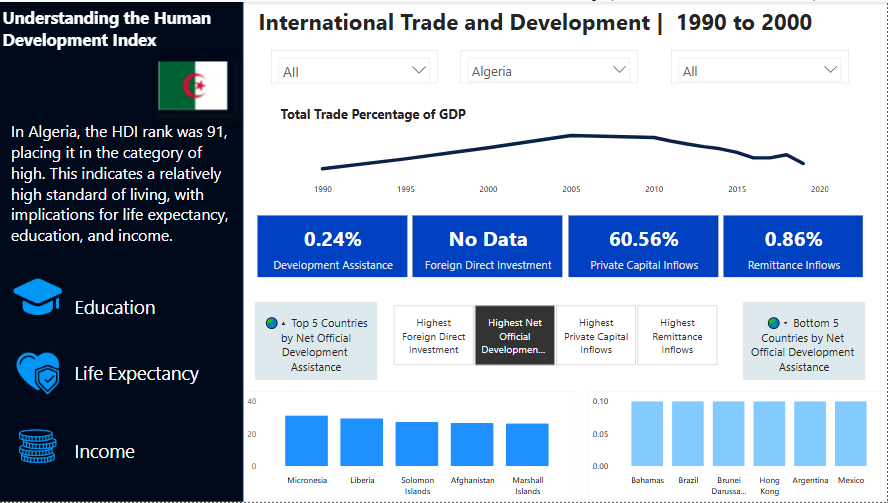
This dashboard visualizes global trade and economic development data from public sources. I used Power BI to transform and model complex datasets, creating an interactive report that explores import/export trends and economic indicators by country. The dashboard serves as a tool for researchers and analysts to quickly identify patterns and disparities in the global economy.
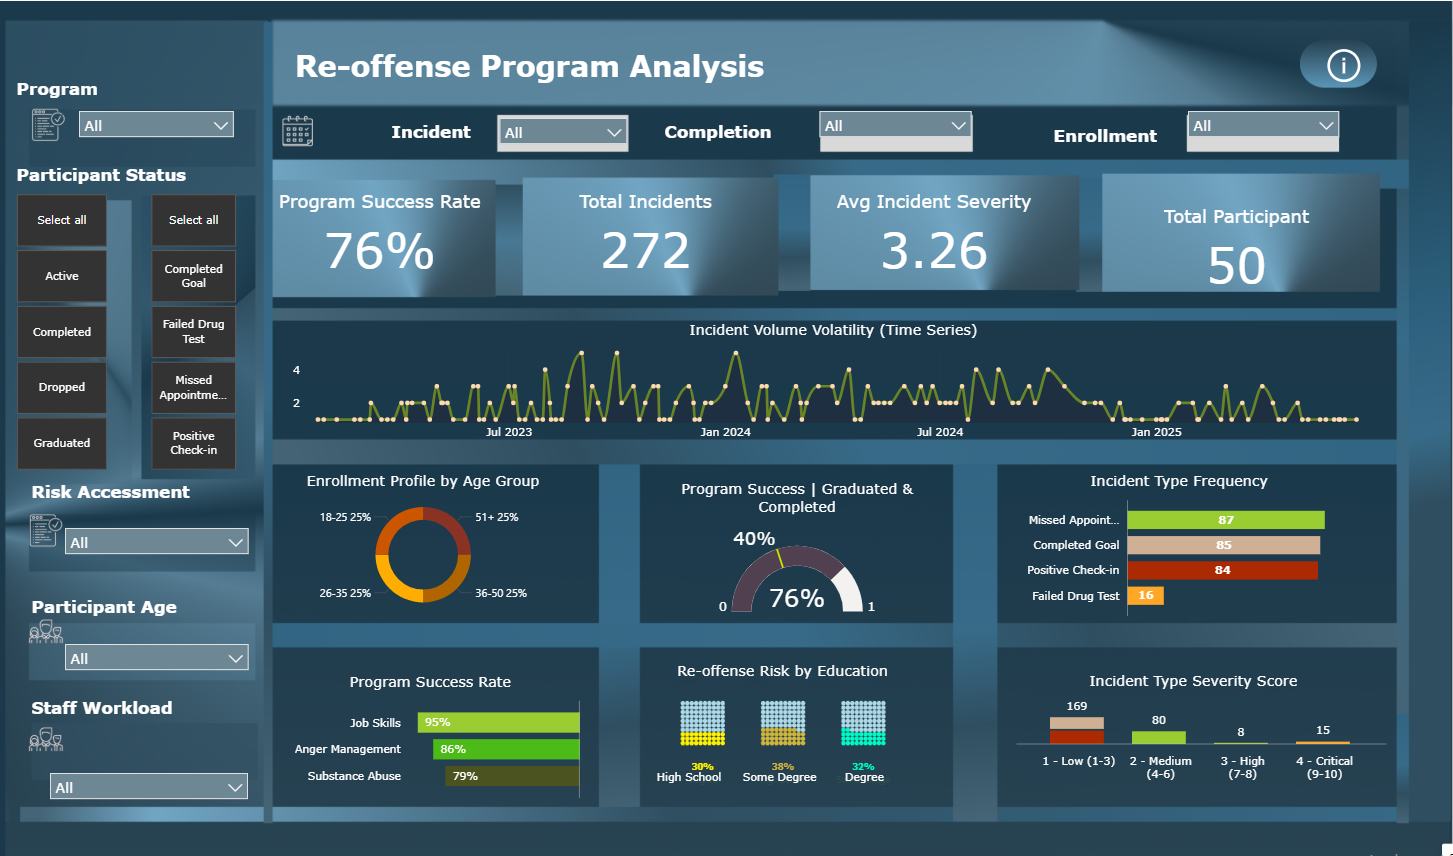
This dashboard was created to help program administrators monitor and manage the success of their programs. It enables organizations to **track success against targets** (example: 76% success!), **identify high-risk individuals** driving re-offense likelihood, and **pinpoint operational drags** (like high-volume missed appointments) to optimize staff time.
I am passionate about using data to solve problems. If you're looking for a skilled data analyst for a project or a full-time role, I'd love to connect and discuss how I can help.
Email Me